Key takeaways
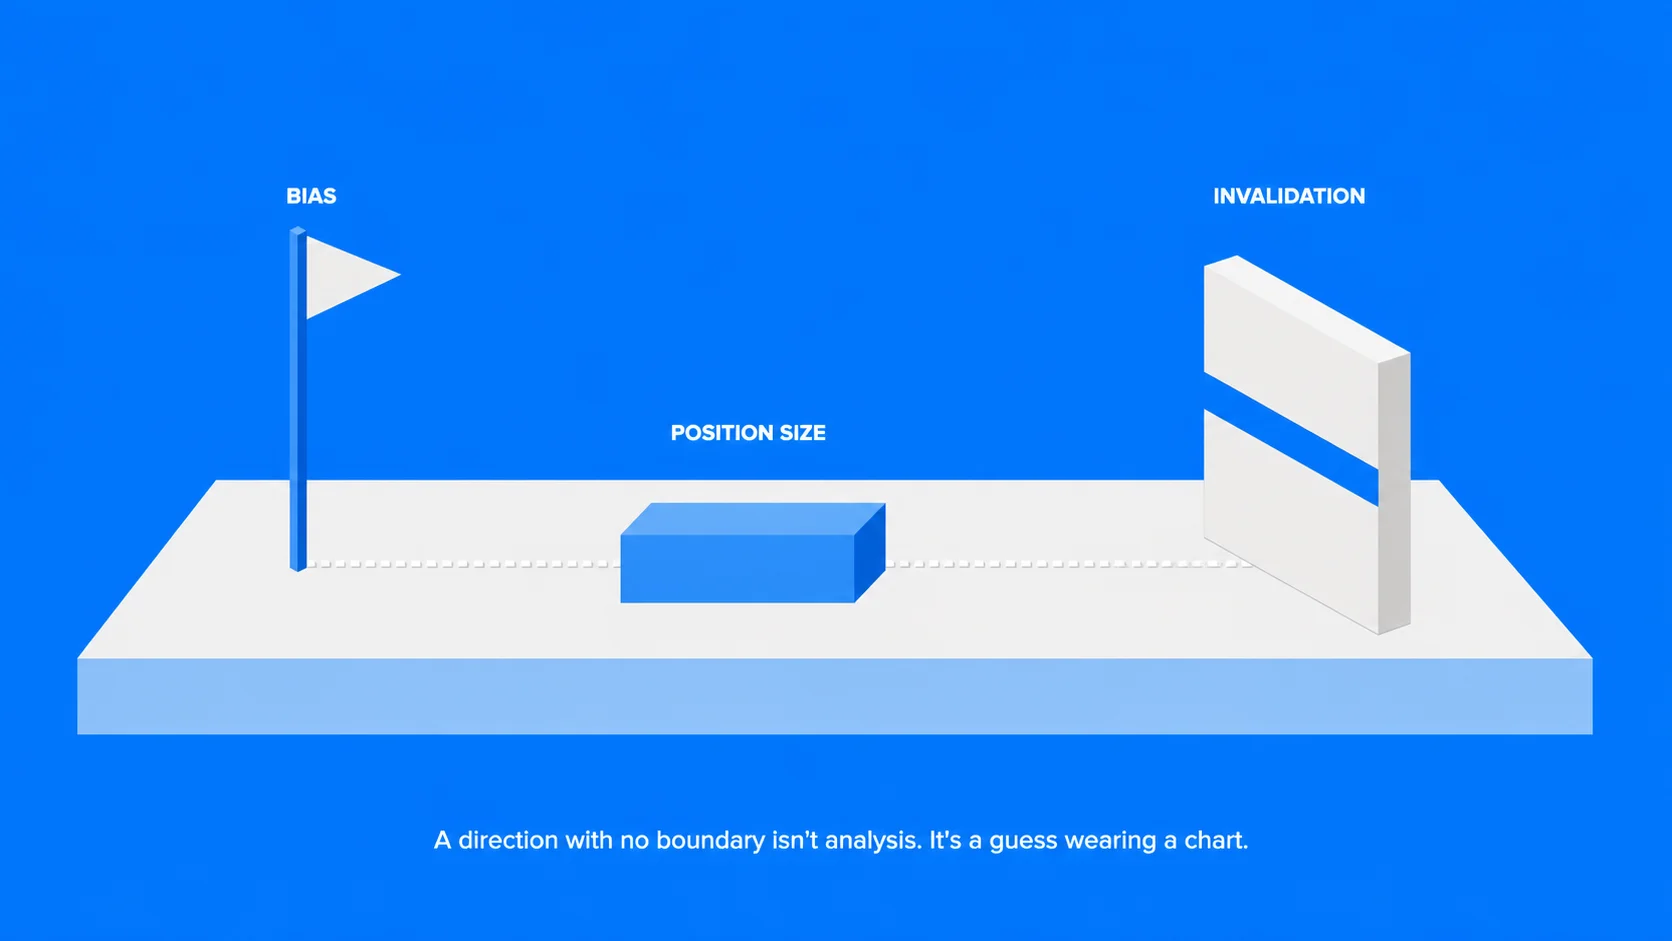
- Analysis does not predict price. It produces three outputs: a directional bias, a level at which that bias is wrong, and a position size proportionate to the distance between them.
- Each method has a horizon where it is informative and one where it is noise. Fundamentals do not time intraday entries; technicals do not survive a surprise rate decision.
- Markets trade the difference between the outcome and the expectation, not the outcome itself. A rate hike everyone forecast can weaken a currency.
- Stacking RSI, Stochastic, and MACD is not confirmation. All three are derived from the same price series, so it is one signal counted three times.
- Sentiment is only actionable at extremes. In the middle of its range it tells you nothing.
What Forex Analysis Actually Produces
The common framing, that analysis forecasts where price will go, sets traders up to fail, because it makes being right the objective and leaves no plan for being wrong.
A completed analysis should produce three specific things:
A bias. A direction you are willing to trade, with a reason attached. “Long EUR/USD” is not a bias. “Long EUR/USD while price holds above 1.0820, on a daily uptrend with ECB policy tightening relative to the Fed” is one.
An invalidation level. The price at which your reason stops being true. This is the more important output, because it determines where the stop sits and therefore what the trade costs when it fails. Analysis that identifies a target but not an invalidation level is an opinion, not a plan.
A position size. The distance from entry to invalidation, combined with your risk-per-trade rule, determines lot size. A wide invalidation demands a small position. This is the mechanism that turns analysis into risk control rather than prediction.
If an analysis routine does not end with those three items written down, it has not finished.
Technical Analysis
Technical analysis studies historical price and volume to identify probable future movement, on the premise that price reflects all available information and that participant behaviour repeats.
Its components, in the order they matter:
Market structure comes first. Higher highs and higher lows define an uptrend; lower highs and lower lows a downtrend; neither a range. Every other tool is interpreted differently depending on which of the three you are in, and misreading structure is the most common source of losing setups.
Support and resistance are price zones where the market previously reversed or consolidated. They work as zones, not lines, and their significance comes from how many times price has reacted there and on what timeframe.
Chart and candlestick patterns (head and shoulders, triangles, flags, engulfing candles, pin bars) describe how price behaves at those levels. They are entry triggers, not standalone signals.
Indicators quantify what the chart already shows. Moving averages measure trend, RSI and Stochastic measure momentum, MACD measures momentum shifts, Bollinger Bands and ATR measure volatility. Configuration and signal rules per indicator are covered in the forex trading indicators guide.
Technical analysis is at its strongest in liquid conditions with no scheduled catalyst: trending majors during the London and New York sessions. It is at its weakest in the minutes around a high-impact release, where positioning unwinds ignore chart levels entirely, and in illiquid hours where thin books produce moves that look like breakouts and are not. Session-by-session liquidity is covered in the forex trading hours guide.
Fundamental Analysis
Fundamental analysis values a currency by the economic condition and policy stance of its issuing country, on the premise that exchange rates converge on economic reality over time.
The hierarchy of drivers is consistent:
- Interest rate policy. The dominant driver. Capital flows toward higher real yields, so decisions and guidance from the Federal Reserve, ECB, Bank of England, Bank of Japan, and others move currencies more than any other scheduled event.
- Inflation. CPI and core CPI drive rate expectations, which is why an inflation print often moves a currency more than the rate decision it eventually causes.
- Employment and growth. US Nonfarm Payrolls (first Friday monthly), unemployment rates, GDP, and PMIs feed the same expectation channel.
- Trade balance and terms of trade. Structural, slow-moving, and dominant for commodity currencies such as AUD, CAD, and NOK.
- Political and geopolitical risk. Drives flight-to-quality flows into USD, CHF, and JPY, on no schedule at all.
The Part Most Guides Omit: Expectations, Not Outcomes
Currencies do not respond to economic data. They respond to the gap between the data and what the market had already priced.
If consensus expects a 25-basis point hike and the central bank delivers exactly that, the currency may not move, or may fall, because the hike was already reflected in the price before the announcement. A hold when the market priced a hike is a dovish surprise, and the currency sells off even though policy did not loosen.
This is why “higher rates mean a stronger currency” fails as a trading rule. What matters is:
- The consensus forecast, published on any economic calendar alongside the previous reading.
- The market-implied probability ahead of the decision, visible in interest rate futures and OIS pricing.
- Forward guidance, the language about future policy, which frequently moves the currency more than the decision itself.
Read the calendar for the expectation before you read the release for the number. A trader who knows only the actual figure has half the information.
Sentiment Analysis
Sentiment analysis measures how market participants are positioned rather than what price or data says. Three sources are not interchangeable.
Retail positioning ratios, published by brokers, show the percentage of clients long versus short a pair. These are read contrarian: retail flow is small relative to the market and skews toward fading trends, so heavy retail long positioning in a downtrend is a continuation signal more often than a reversal one.
The CFTC Commitments of Traders report, published Friday for Tuesday’s positions, splits futures positioning into commercial hedgers, large speculators, and small speculators. Large speculators are trend followers, and extremes in their net positioning have historically preceded reversals. Commercials hedge business exposure and are structurally on the other side, so their positioning is not a directional signal in the same way.
Volatility and risk appetite measures (the VIX, credit spreads, and the performance of JPY and CHF against higher-yielding currencies) indicate whether capital is seeking risk or safety.
The limitation stated in almost no competing guide: sentiment is only actionable at extremes. Positioning at 55% long carries no information. Positioning at 90% long, at the end of an extended move, is a genuine signal. Between those points, sentiment is context, not a trigger.
Which Method Works Over Which Horizon
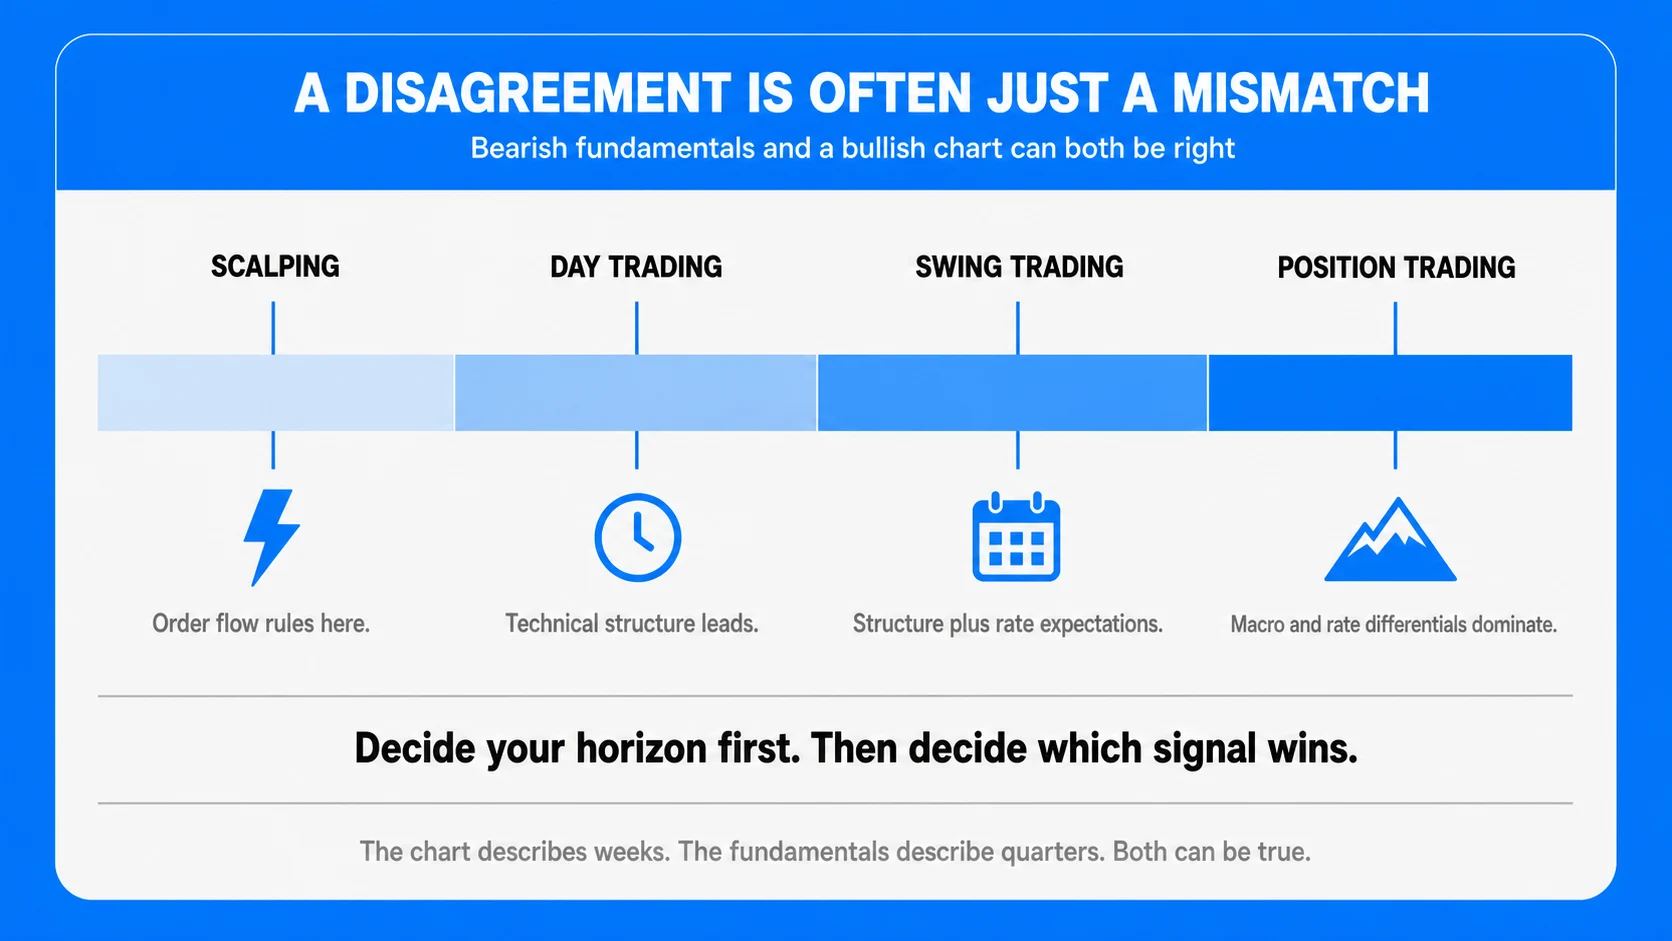
| Holding period | Primary method | Secondary | Largely irrelevant |
| Scalping (minutes) | Order flow, structure, spread conditions | Session timing | Fundamentals, sentiment |
| Day trading (hours) | Technical structure and levels | The day’s calendar events | Long-term valuation |
| Swing trading (days to weeks) | Technical structure on H4/daily | Rate expectations, sentiment extremes | Tick-level flow |
| Position trading (weeks to months) | Interest rate differentials, macro | Weekly technical structure | Intraday patterns |
The practical implication is that a disagreement between methods is usually a horizon mismatch, not a contradiction. Bearish fundamentals and a bullish daily chart can both be correct: the chart is describing the next two weeks and the fundamentals the next two quarters. Decide which horizon you are trading before deciding which signal wins.
Top-Down Analysis: The Framework That Combines Them
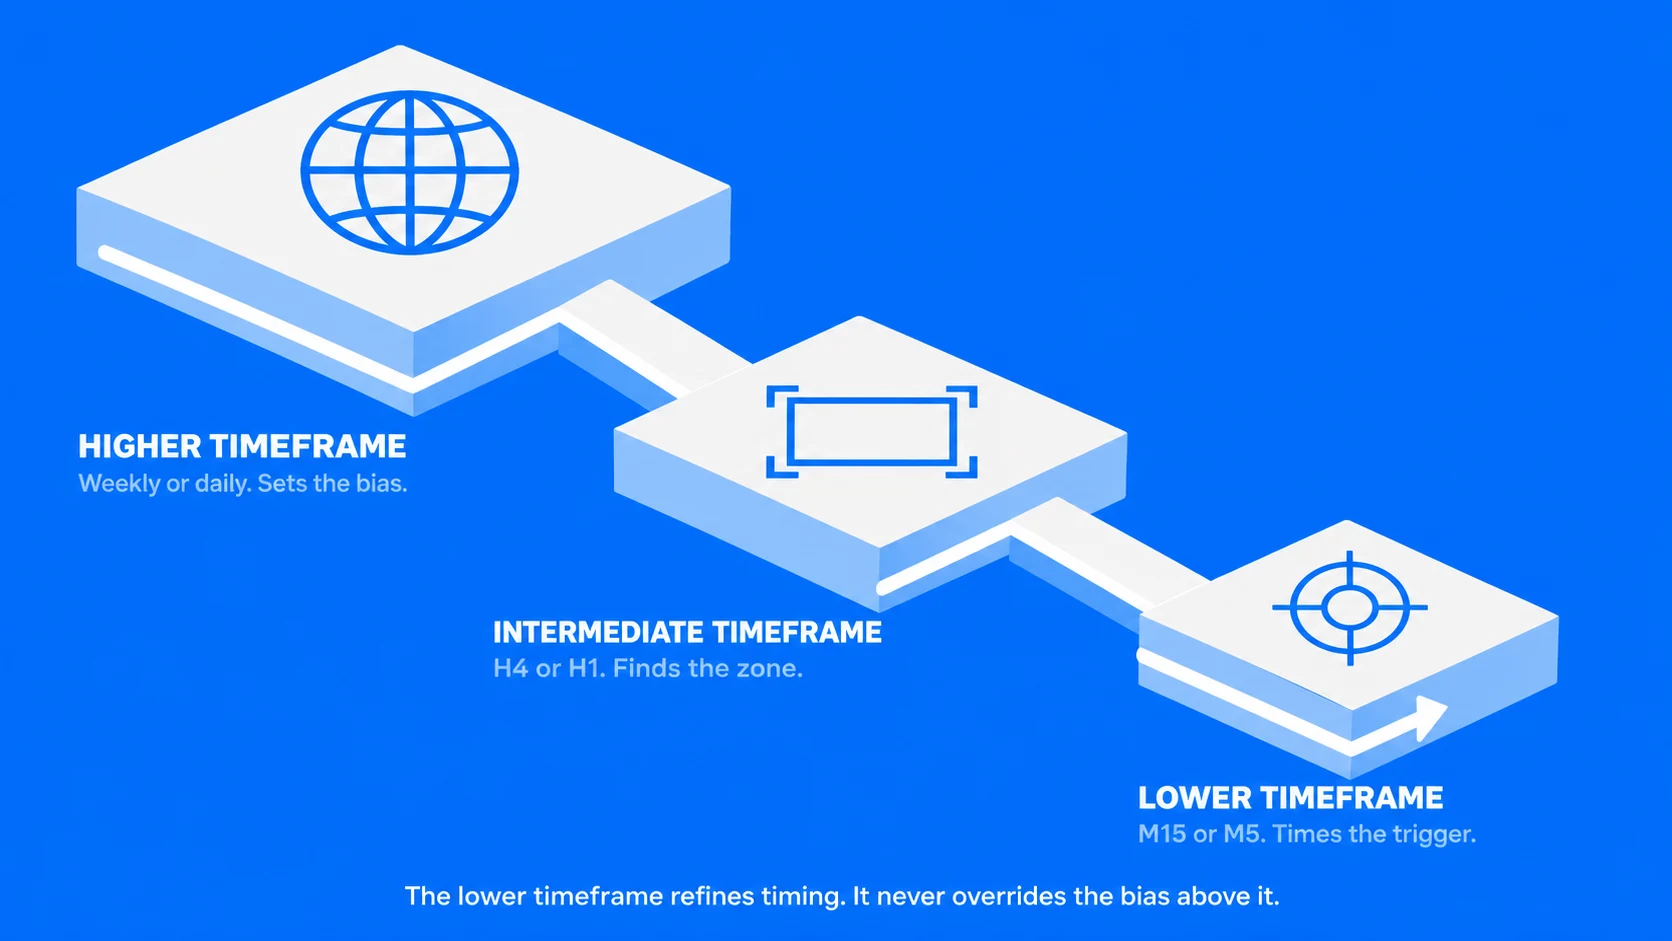
Top-down analysis moves from the broadest context to the narrowest entry, so that bias is set before a setup is ever considered. The alternative, finding an attractive setup on a small chart and then hunting for reasons to justify it, is how counter-trend trades enter a plan.
Use three timeframes, spaced by a ratio of roughly 4:1 to 6:1 so each carries genuinely different information:
Higher timeframe (bias). Weekly or daily. Identify trend structure and mark major support and resistance. Overlay the macro picture: which of the two currencies has the stronger policy trajectory. Output: long, short, or stand aside.
Intermediate timeframe (structure). H4 or H1. Locate the zones where a trade in your direction is available at a good price, typically pullbacks into support in an uptrend. Set alerts there rather than watching. Output: a defined area of interest and the level that invalidates it.
Lower timeframe (trigger). M15 or M5. Wait for a specific entry signal within that zone: a rejection candle, a break of a minor structure, a momentum shift. Output: entry price, stop placement, size.
The lower timeframe refines timing. It never overrides the higher timeframe bias. If they conflict, there is no trade.
Worked example. The daily EUR/USD chart shows higher highs and higher lows with price above the 50-day moving average; ECB guidance is firmer than the Fed’s. Bias: long. On H4, price pulls back into a support zone at 1.0850 that previously acted as resistance; invalidation sits below 1.0820. On M15, a bullish engulfing candle forms at 1.0855. Entry 1.0860, stop 1.0815, 45 pips of risk, position sized so those 45 pips equal 1% of the account. Target at the prior daily high, 1.0990, a 2.9:1 reward-to-risk ratio.
The Confluence Trap
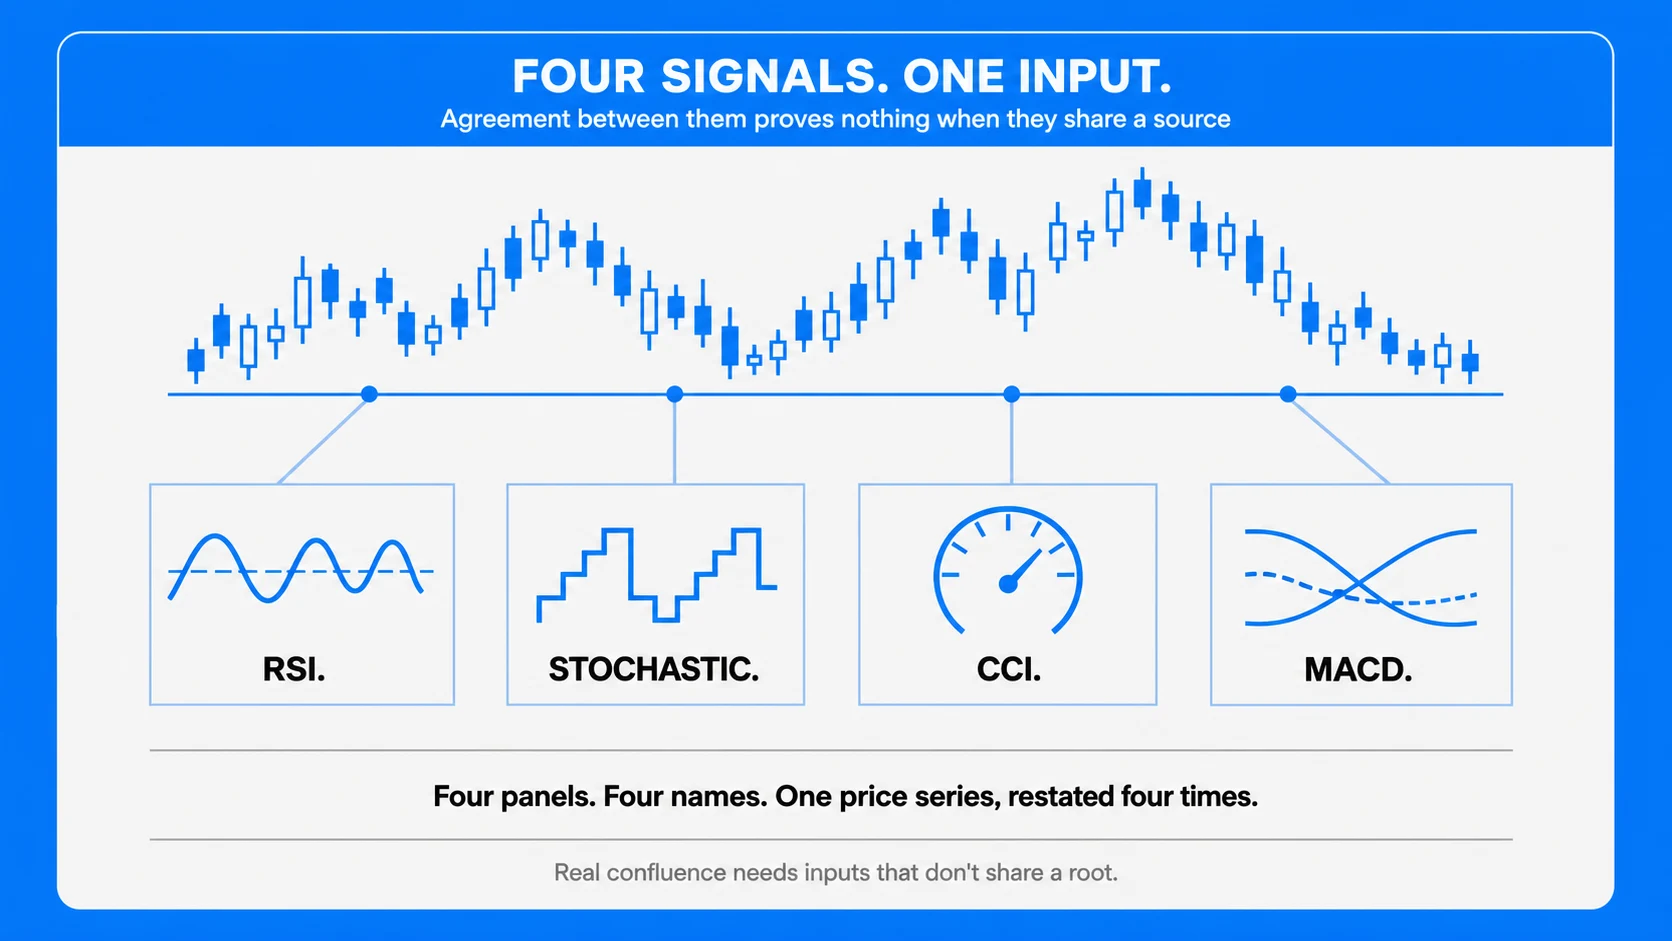
Standard advice says to confirm a signal with two or three indicators. This is where a great deal of retail analysis quietly breaks.
RSI, Stochastic, CCI, and MACD are all mathematical transformations of the same closing prices. When all four agree, they have not independently confirmed anything; they have restated one input four times. The trader experiences this as high conviction, which is precisely the problem: false confidence built from redundant data.
Real confluence requires inputs that are genuinely independent:
- Price structure (where the market has actually traded)
- One indicator, at most two, measuring different properties (one trend, one momentum, not two momentum)
- A different timeframe
- A non-price input: the economic calendar, positioning data, or correlated market behaviour
Two independent confirmations outperform five correlated ones. If adding a tool has never once made you skip a trade, it is not filtering anything.
Correlation: The Input Almost Nobody Includes
Currency pairs are not independent instruments. EUR/USD and USD/CHF are strongly negatively correlated; long EUR/USD and short USD/CHF are one position at double size, not two diversified trades. AUD/USD and NZD/USD frequently move together. USD/CAD tracks crude oil inversely.
Two practical steps. Check the US Dollar Index (DXY) before trading any USD pair, since it often reveals whether a move is dollar-driven or specific to the counter currency, which changes the trade entirely. And before opening a second position, ask whether it is genuinely a new trade or the same directional bet expressed twice, because correlated positions concentrate risk exactly when a shock hits.
A Practical Analysis Routine
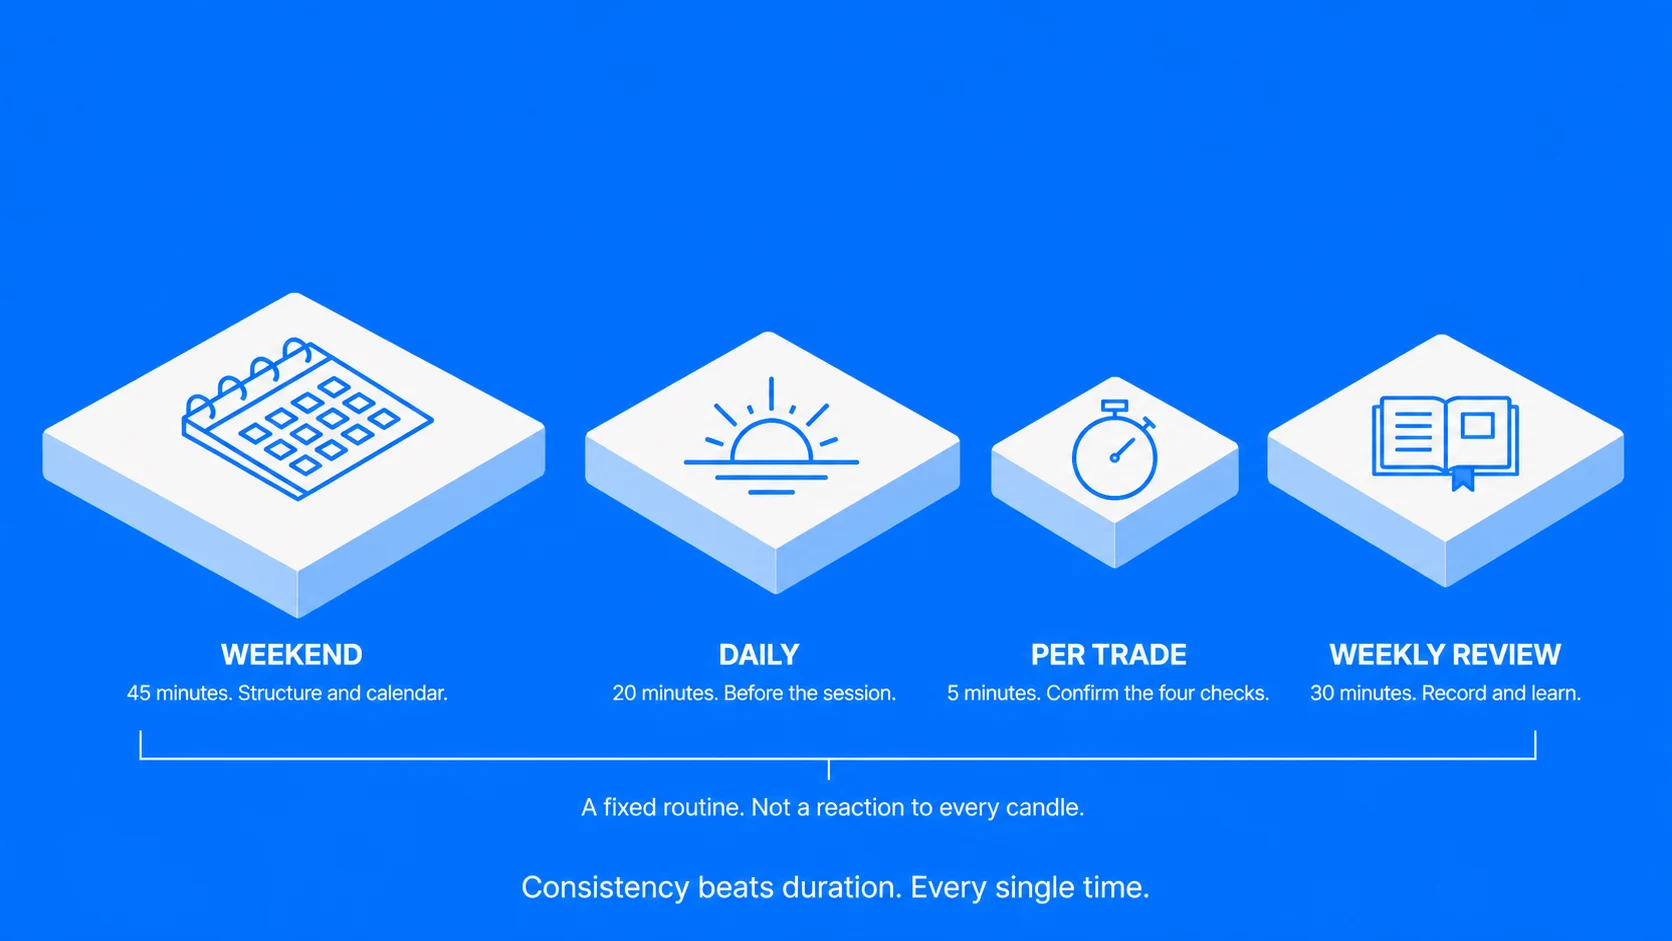
Analysis fails more often from inconsistency than from lack of knowledge. A fixed routine with a time budget prevents both drift and analysis paralysis.
Weekend, 45 minutes. Review weekly and daily charts on the pairs you trade. Mark major levels. Note trend structure per pair. Read the coming week’s economic calendar and flag high-impact events with their consensus forecasts. Write a one-line bias per pair, or “no bias.”
Daily, 20 minutes before your session. Check overnight moves against your levels. Confirm no high-impact release falls in your trading window, or plan around it. Identify two or three pairs where price is approaching an area of interest. Set alerts. Do not open charts you have no plan for.
Per trade, 5 minutes. Confirm the higher timeframe bias still holds, the entry trigger is present, the invalidation level is defined, and the position size follows from it. If any of the four is missing, there is no trade.
Weekly review, 30 minutes. Record every trade with the analysis that justified it and the outcome. Over a sample of thirty or more trades, this is the only evidence that your analysis has an edge. Without the record, you are relying on recall, which systematically over-remembers wins.
Where Analysis Stops Working
An honest guide has to state the limits.
Analysis describes probabilities, not certainties, and a correct analysis can lose. Judging a method by the outcome of a single trade is the fastest way to abandon something that works.
Some events are outside any analytical framework: the Swiss National Bank’s 2015 removal of the EUR/CHF floor moved the pair roughly 30% in minutes, through every stop, level, and model. Nothing on a chart or in a data release forecast it. Only position size and account structure determine survival in that scenario, which is why risk management sits above analysis rather than beside it.
Analysis also degrades with overfitting. A rule fitted to explain the last six months of a specific pair is describing history, not a repeating behaviour. And confirmation bias is the standing occupational hazard: the market always offers a timeframe or indicator that agrees with the position you already want. Top-down order exists to prevent exactly that.
Analysing the Market on UEXO
Analysis needs tools that keep pace with it. UEXO runs MT4 and MT5 on desktop, web, and mobile, with MT5 adding 21 timeframes, depth of market, and a multi-currency strategy tester for validating rules before risking capital on them. Both platforms support multi-chart layouts for top-down workflow and custom indicators for anything the defaults do not cover.
Analysis on a demo account is free but incomplete: it does not model slippage, and it does not test whether you follow your own plan when money is live. The cheapest way to close that gap is a small live position sized so the outcome is educational rather than expensive.
Put your analysis to work. open a live account and trade forex pairs on spreads from 0.0 pips, or compare account tiers to match pricing to your trading horizon. Short-horizon analysis needs raw spreads; longer holds need favourable swap rates, and the difference is set out in the forex trading costs guide.
What is forex trading analysis?
It is the process of examining price data, economic conditions, and market positioning to form a directional bias on a currency pair, define the level at which that bias is wrong, and size a position accordingly.
Which is better, technical or fundamental analysis?
Neither is better; they operate over different horizons. Technical analysis times entries over hours to weeks. Fundamental analysis explains direction over weeks to quarters. Traders holding positions for days or longer need both.
Can I trade forex with technical analysis alone?
Yes, and many intraday traders do. The exception is scheduled high-impact events, where positioning unwinds override chart levels. At minimum, check the economic calendar before trading, even if you never trade the releases themselves.
How many indicators should I use?
Two or three that measure different properties, at most. Stacking multiple momentum oscillators produces redundancy that feels like confirmation. If a tool has never caused you to skip a trade, remove it.
What timeframes should I analyse?
Three, spaced roughly 4:1 to 6:1: a higher timeframe for bias, an intermediate one for structure and levels, a lower one for entry timing. Swing traders commonly use daily, H4, and M15; day traders H4, H1, and M5.
Is sentiment analysis reliable?
Only at extremes. Retail positioning ratios above roughly 80% on one side, or record COT speculative positioning, carry information. Readings near the middle of the range do not, and sentiment should confirm a technical or fundamental case rather than generate one on its own.
How long does forex analysis take each day?
A workable routine runs about 45 minutes at the weekend for structure and calendar review, 20 minutes before each session, and 5 minutes per trade. Consistency matters more than duration.