Key takeaways
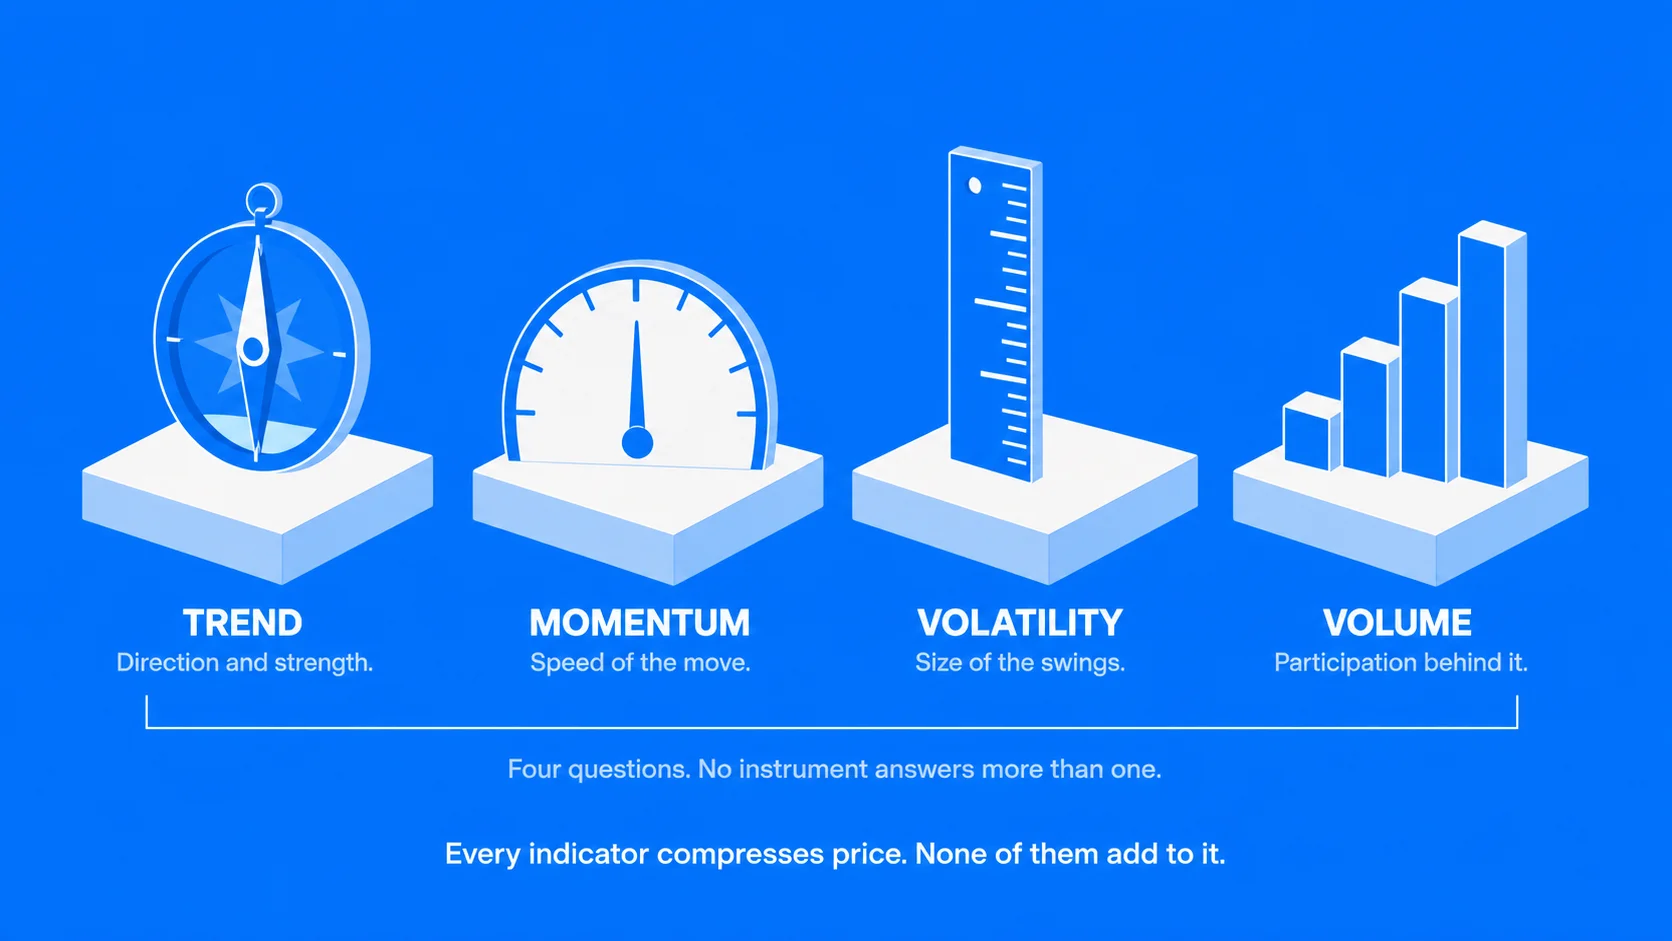
- Indicators compress price data; they never add information to it.
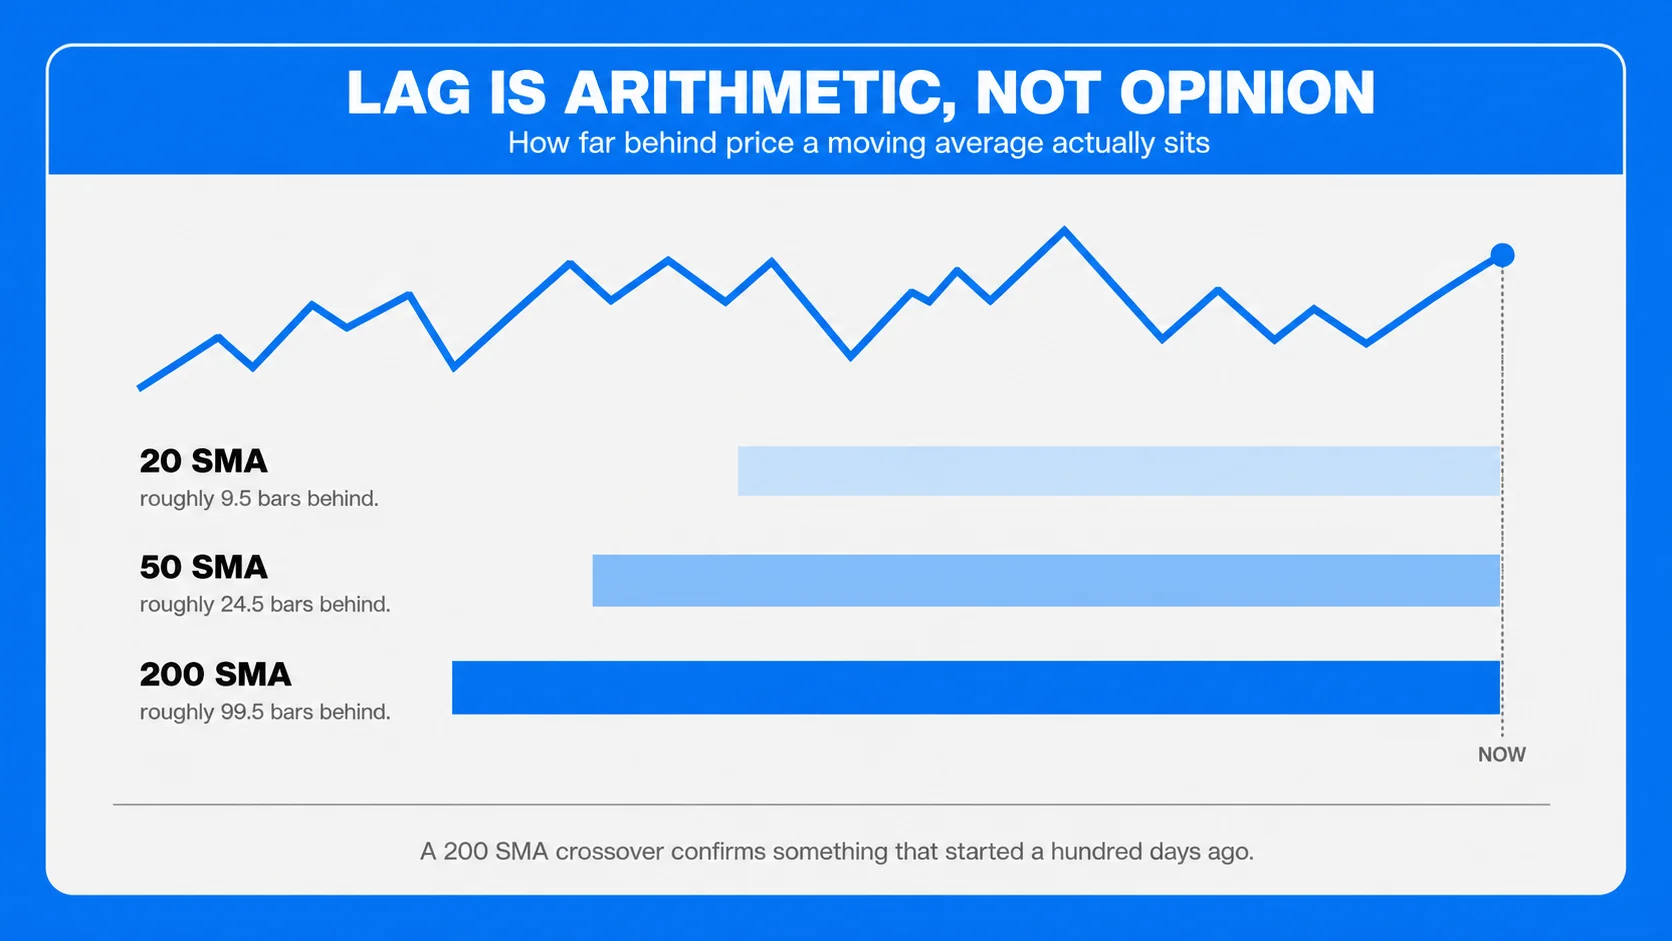
- Lag is arithmetic, not opinion: a 50-period moving average sits roughly 25 bars behind price by construction.
- RSI, Stochastic, CCI, and Williams %R measure the same thing. Running several is one signal counted repeatedly.
- Determine the market regime first (trending or ranging), then choose the indicator class. Oscillators fail in trends; trend tools fail in ranges.
- RSI above 70 is not a sell signal. In a strong trend it can stay there for weeks.
The Four Categories
| Category | What it measures | Common tools | Works best in |
| Trend | Direction and strength of a move | Moving averages, MACD, ADX, Ichimoku | Trending markets |
| Momentum | Speed of price change, stretch | RSI, Stochastic, CCI, Williams %R | Ranging markets |
| Volatility | Size of price movement | Bollinger Bands, ATR, Keltner Channels | Both, for sizing and regime |
| Volume | Participation behind a move | Volume, OBV, tick volume in forex | Confirmation only |
Forex has a caveat on the last row. Because the market is decentralised with no central exchange, there is no true consolidated volume. Platforms display tick volume, the number of price changes per bar, which correlates with real volume but is not the same measurement. Treat forex volume indicators as a rough activity proxy, not the figure an equities trader would be reading.
Trend Indicators
Moving averages smooth price into a single line showing direction. A simple moving average (SMA) weights all periods equally; an exponential moving average (EMA) weights recent prices more heavily and therefore turns faster. Common settings are 20 (short-term), 50 (intermediate), and 200 (long-term, widely treated as the line separating bull and bear conditions).
Beyond direction, moving averages serve as dynamic support and resistance and as crossover signals, where a faster average crossing a slower one marks a possible trend change. The widening gap between two averages indicates strengthening trend.
MACD (12, 26, 9) subtracts a 26-period EMA from a 12-period EMA, then plots a 9-period EMA of that result as a signal line, with the difference shown as a histogram. Crossovers indicate momentum shifts; the histogram shows whether momentum is building or fading. Note the construction, because it matters later: MACD is built from moving averages, so it is not an independent check on them.
ADX measures trend strength without indicating direction, on a 0 to 100 scale. Readings above 25 indicate a trending market; below 20 indicate a range. This is the most underused indicator in retail forex and, as the next section explains, arguably the one that should be consulted first.
Momentum Indicators
RSI (14 periods, Wilder’s 1978 default) measures the speed and magnitude of recent price changes on a 0 to 100 scale. Above 70 is conventionally called overbought, below 30 oversold.
Stochastic (14, 3, 3) compares the current close to the recent high-low range, on the premise that closes cluster near the highs in uptrends and near the lows in downtrends. Same 70/30 or 80/20 convention.
CCI and Williams %R do the same job with different arithmetic. Williams %R is effectively an inverted Stochastic %K.
Volatility Indicators
Bollinger Bands (20, 2) plot a 20-period SMA with bands two standard deviations above and below. The bands widen as volatility rises and contract as it falls. A prolonged contraction, the squeeze, frequently precedes a large directional move, though the bands do not indicate which direction.
ATR (14) measures the average true range per bar in price terms. It generates no entry signals at all, which is why it is often skipped, and that is a mistake. Its value is in risk, covered below.
Lag Is Arithmetic
Competing guides describe moving averages as “lagging” without quantifying it. The lag is calculable and worth knowing exactly.
For an n-period simple moving average, the average age of the data in the calculation is (n−1)/2 bars. A 20 SMA is therefore centred roughly 9.5 bars behind current price; a 50 SMA roughly 24.5 bars; a 200 SMA roughly 99.5 bars. An EMA with the equivalent smoothing factor carries the same average lag, though it responds faster to recent moves.
Two consequences follow. First, a 200 SMA crossover on a daily chart is confirming something that began around a hundred days ago; it is a regime marker, not a timing tool. Second, when a moving average “fails” in choppy conditions, it has not malfunctioned. It is reporting an average that no longer describes a market changing direction faster than the averaging window.
The Redundancy Problem
Standard advice is to confirm signals with two or three indicators. What that advice omits is which combinations actually constitute confirmation.
| Combination | Independent? | Why |
| RSI + Stochastic | No | Both momentum oscillators on the same closes |
| RSI + CCI + Williams %R | No | Three formulations of one measurement |
| MACD + moving averages | Partly | MACD is constructed from EMAs |
| Bollinger Bands + 20 SMA | No | The middle band is a 20 SMA |
| Moving average + RSI | Yes | Trend and momentum, different properties |
| ADX + RSI | Yes | Regime and momentum |
| Any indicator + a higher timeframe | Yes | New data window |
| Any indicator + the economic calendar | Yes | Non-price input |
When four correlated oscillators agree, they have not confirmed a trade. They have restated one number four times, and the trader experiences that redundancy as conviction, which is worse than no signal at all.
A useful test: if a tool on your chart has never caused you to skip a trade you otherwise wanted, it is decorating the chart, not filtering it.
Regime First, Indicator Second
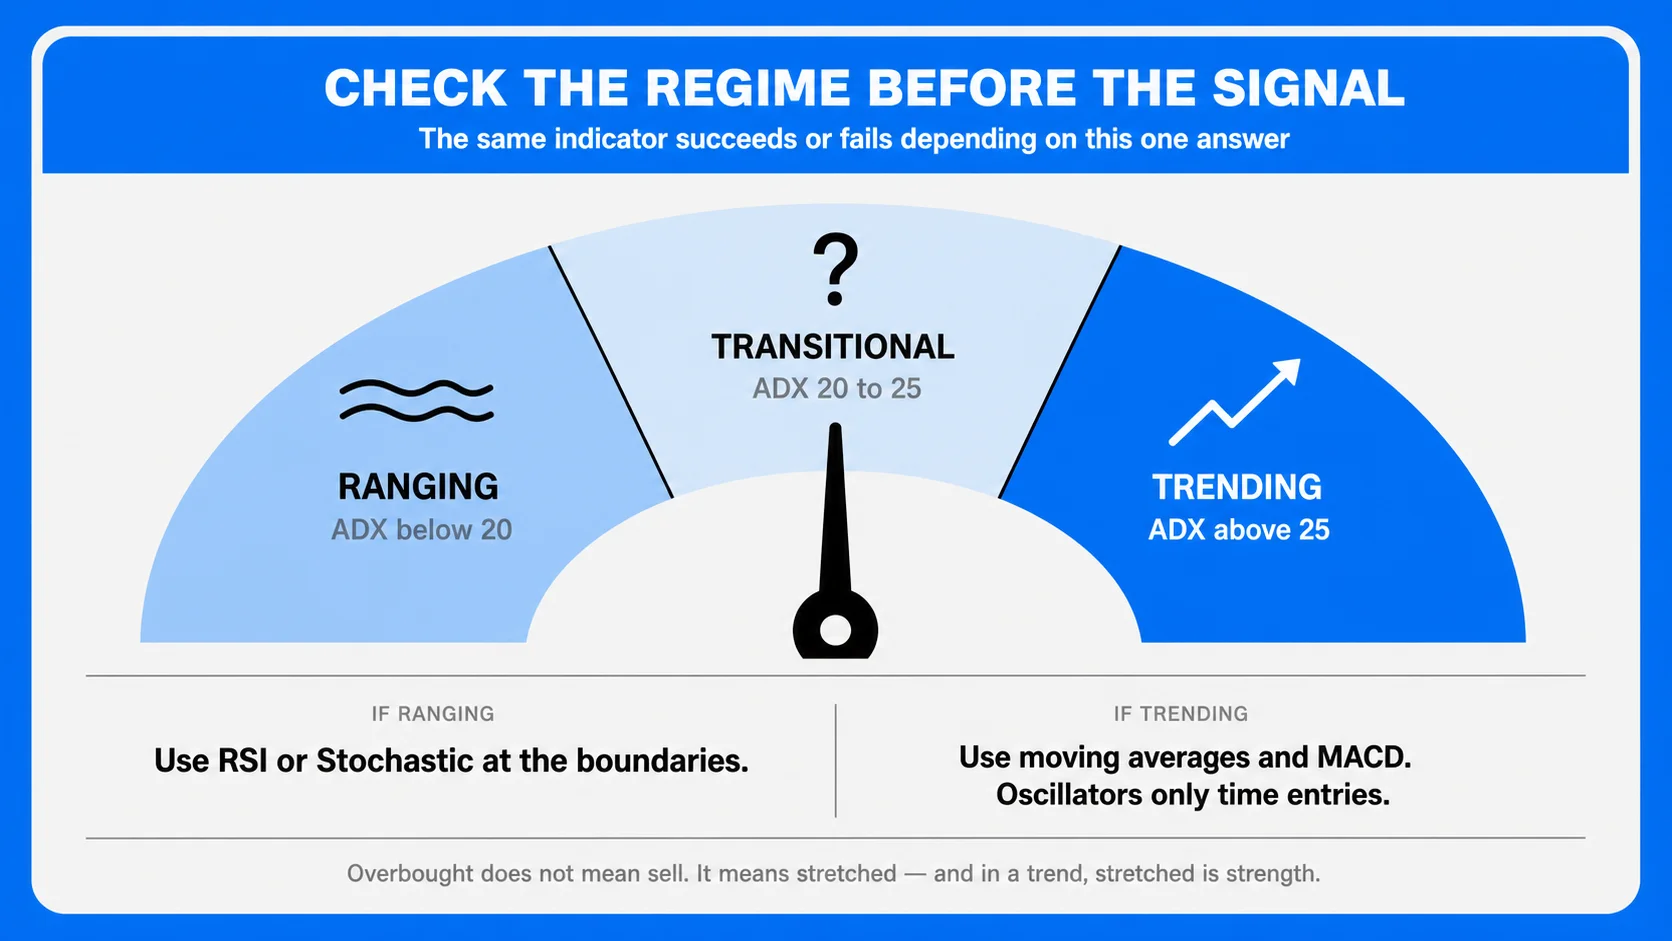
Almost every “the indicator gave a false signal” complaint traces one error: running a ranging tool in a trending market or the reverse.
Oscillators like RSI and Stochastic assume mean reversion, that a stretched price returns to a middle. That assumption holds in ranges and breaks in trends. In a strong uptrend, RSI can hold above 70 for weeks while price continues higher, and every oversold reading you fade is a losing short.
Trend tools make the opposite assumption, that movement continues. In a range, moving average crossovers whipsaw repeatedly, generating losses on both sides.
The fix is sequencing. Read ADX or market structure first:
- ADX above 25, structure showing higher highs and higher lows: trending. Use moving averages, MACD, and structure. Use oscillators only to time pullback entries in the trend direction, never to fade it.
- ADX below 20, price oscillating between horizontal levels: ranging. Use RSI or Stochastic at range boundaries. Ignore crossover signals.
- ADX between 20 and 25: transitional. The lowest-quality environment for indicator signals of any kind.
Overbought does not mean sell. It means stretched. In a trend, stretched is what strength looks like.
Divergence: The Non-Redundant Use of Oscillators
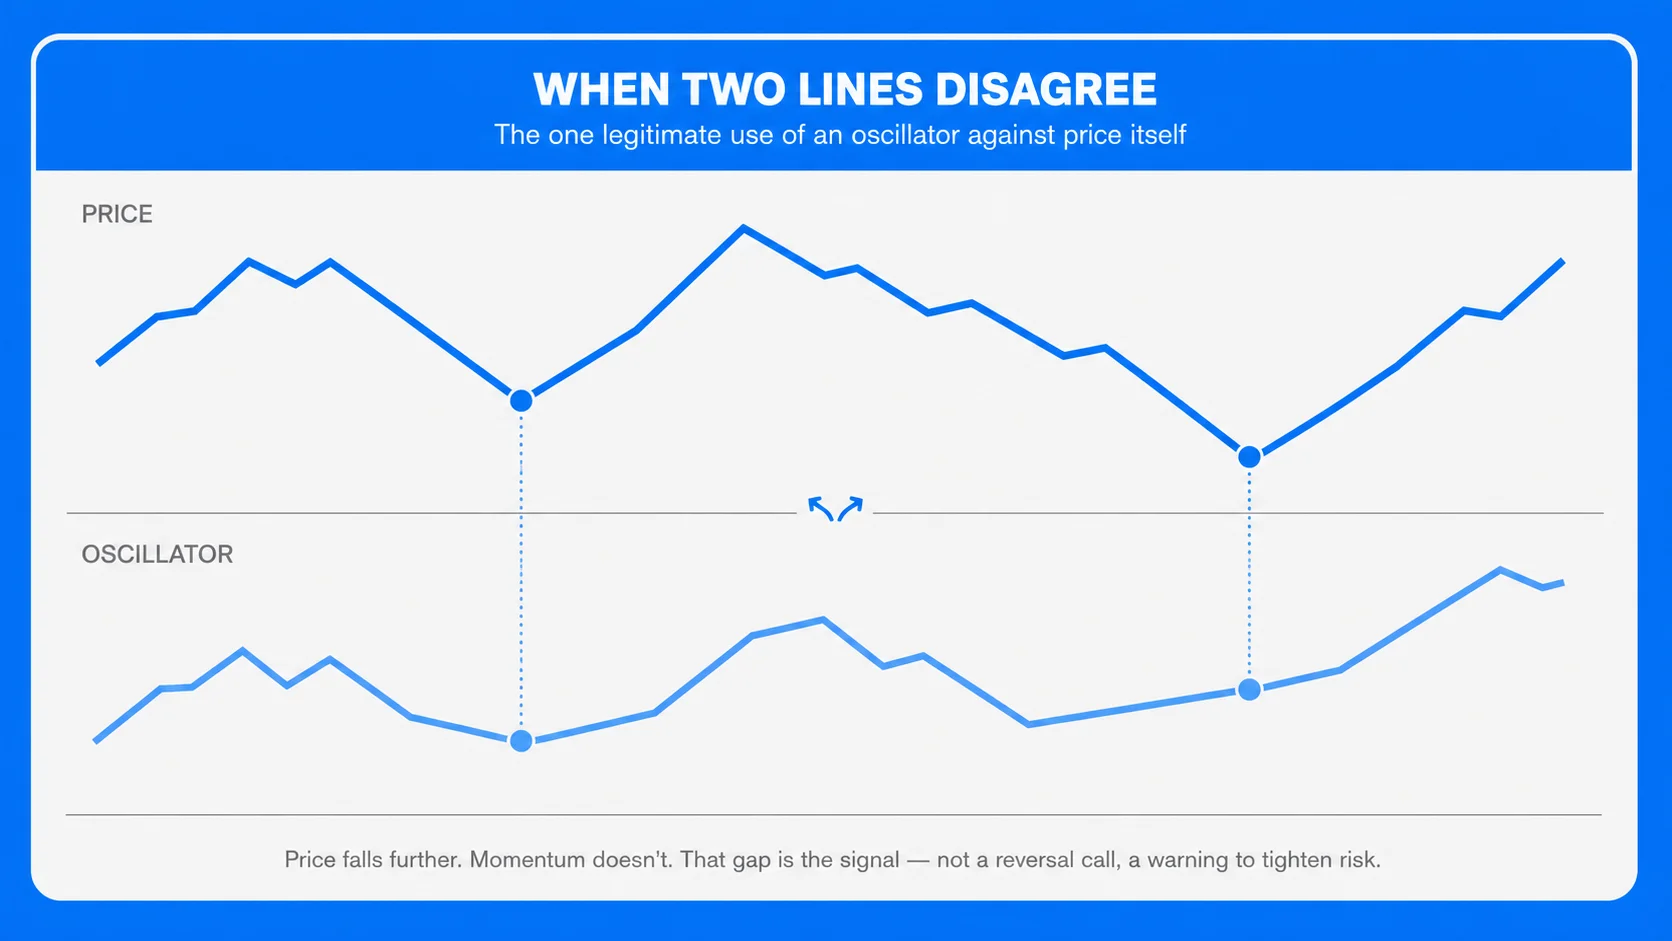
There is one application where an oscillator adds a genuinely second dimension rather than restating price: divergence.
Bullish divergence occurs when price makes a lower low while the oscillator makes a higher low, indicating that downward momentum is weakening even as price falls. Bearish divergence is the mirror. This works because you are comparing two different measurements, price level against rate of change, rather than reading one measurement twice.
Two conditions for using it: divergence signals exhaustion, not reversal, so it warrants tightening risk or waiting rather than immediately entering opposite the trend, and it is far more reliable on H4 and daily charts than on M5, where noise generates constant false divergences.
ATR: The Indicator That Sizes Trades
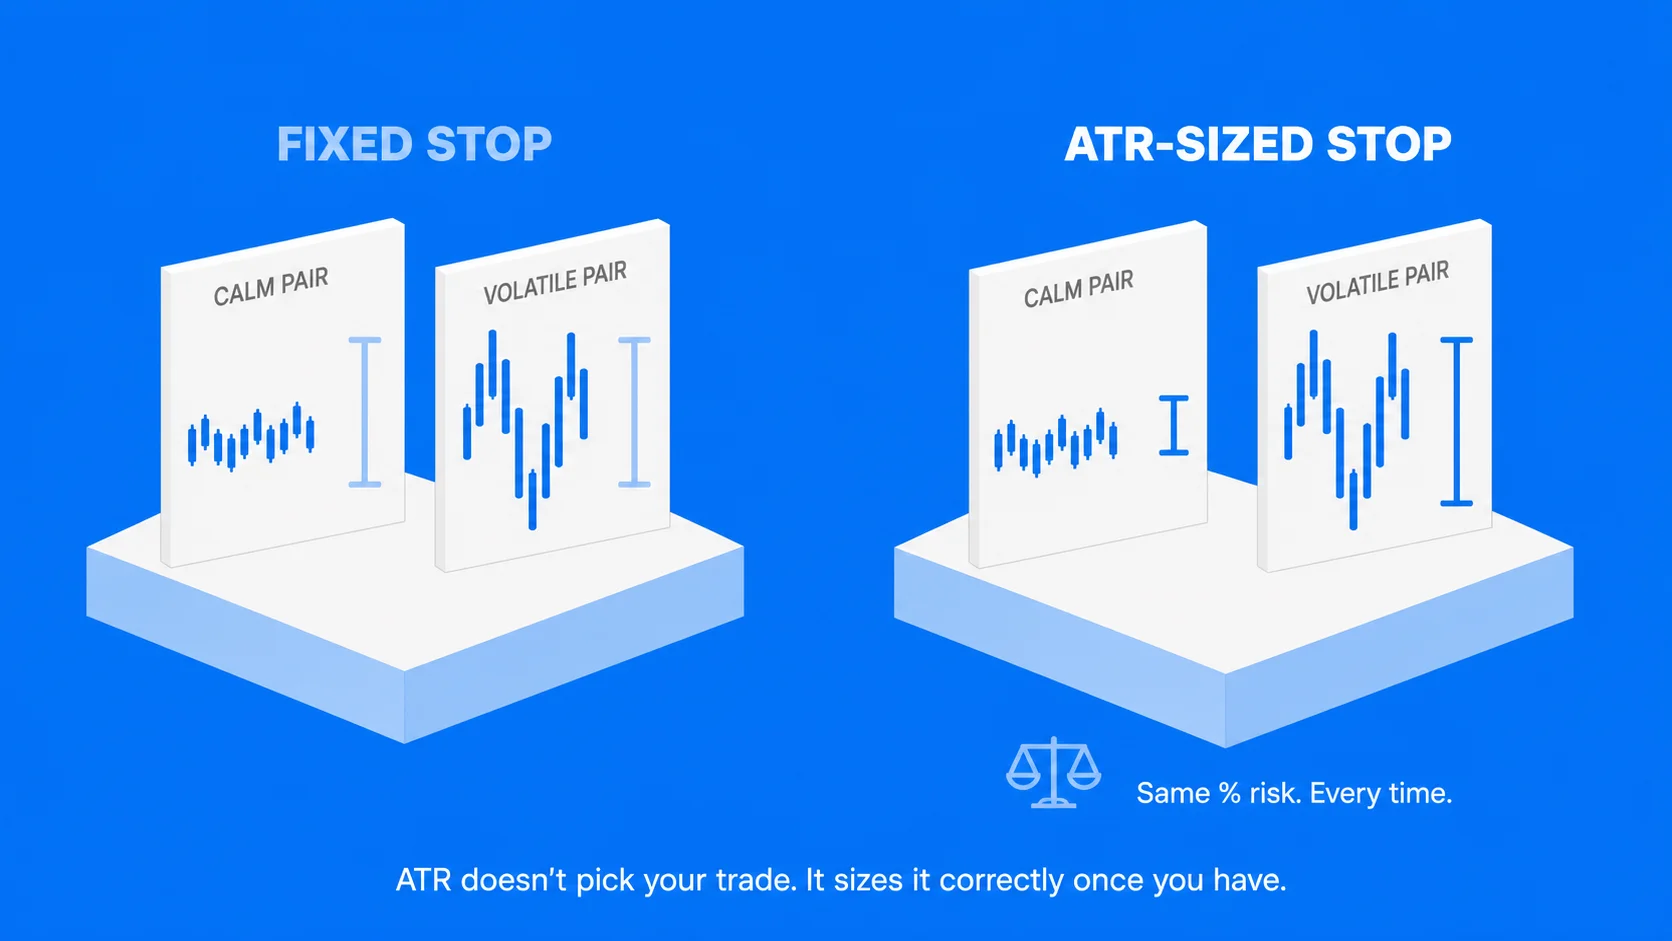
ATR produces no buy or sells signal, and that is exactly why it belongs on the chart. It answers a different question: how far does this pair normally move, right now?
Two uses.
Stop placement. A stop set at a fixed 20 pips is too tight on GBP/JPY and too wide on EUR/CHF, and the same 20 pips means different things during the London session and the Asian session. Setting stops at a multiple of ATR (commonly 1.5 to 2 times) places them beyond normal noise regardless of pair or conditions.
Position sizing. Once the stop distance is volatility-normalised, lot size follows from your risk-per-trade rule: risk amount divided by stop distance in pips, divided by pip value. Every trade then risks the same percentage of the account despite different pairs and different volatility. This is how indicators contribute to survival rather than to entries, and it is the most valuable thing on this page for a trader who already knows what RSI is.
Settings: Why the Defaults Usually Win
Standard settings are historical artifacts. RSI 14 comes from Welles Wilder’s 1978 book, written for daily commodity charts. MACD 12, 26, 9 comes from Gerald Appel and reflects a six-day trading week. Bollinger’s 20, 2 comes from his own work in the 1980s. None was derived as an optimum for EUR/USD in 2026.
Yet changing them is usually a mistake, for two reasons.
First, altering a period changes the question, not the accuracy. A 7-period RSI is not a better RSI; it is a measurement of a shorter window, which produces more signals of lower individual reliability. Neither setting is right in the abstract; the choice should follow your holding period.
Second, defaults are reflexive. Because a very large number of participants watch RSI 14, the 200-day moving average, and the 20,2 bands, price reacts at those levels partly because everyone is watching them. A privately optimised 37-period average has no such following. You gain a marginally better fit to past data and lose the crowd behaviour that made the level meaningful.
Optimising settings until a backtest looks good is curve fitting: describing history rather than finding repeating behaviour. If a rule only works at period 37 and fails at 35 and 39, it has found noise.
The Close-of-Bar Rule
The value an indicator shows on the current, unfinished candle is provisional. A moving average crossover visible mid-bar can vanish before the bar closes; an RSI reading of 71 can end the bar at 68. Traders who enter on mid-bar signals are acting on values that do not exist once the bar completes, then conclude the indicator is unreliable.
Take signals on closed bars. This costs a little of the move and removes an entire class of false entries. The same principle explains why some third-party indicators appear extraordinarily accurate in hindsight: they recalculate historical values as new data arrives, so the chart shows signals that were never available in real time. Test anything unfamiliar on a demo in live conditions before trusting a backtest of it.
Three Combinations That Work
Trend following: 50 EMA for direction, ADX above 25 to confirm the regime, RSI used only to time pullback entries in the trend direction. Three tools, three different jobs.
Range trading: horizontal support and resistance marked manually, Stochastic for timing at the boundaries, ADX below 20 as the filter that says the range is intact.
Breakout trading: Bollinger Band squeeze to identify volatility compression, ATR to size the position and place the stop once the move begins, volume or tick volume as weak confirmation that participation is behind the break.
In every case, structure comes first and indicators time the entry. Selecting a strategy to run them within is covered in the forex trading strategies guide, and the wider analytical framework sits in the forex market analysis guide.
Common Mistakes
Loading a chart with six or more tools until they contradict each other and no trade is ever clean. Using oscillators to fade a strong trend. Changing settings after a losing trade, which fits the tool to the last outcome rather than to the market. Ignoring the session: indicator signals during the illiquid rollover hour are far less reliable than the same signals during the London-New York overlap, as covered in the forex trading hours guide. And treating an indicator as a system, when it is one input into a plan that also needs an invalidation level and a position size.
Running Indicators on UEXO
Both MT4 and MT5 ship with the full standard set and support custom indicators. MT4 carries around 30 built-in indicators and the largest third-party library in retail trading. MT5 adds roughly 38 built-ins, 21 timeframes, and a multi-threaded strategy tester that lets you validate an indicator rule across pairs before committing capital to it. Both run on desktop, web, and mobile, so alerts set on one device reach you on another.
Test your setup on live prices. Open an account to run your indicators on live forex pairs with spreads from 0.0 pips, or compare account tiers first, since indicator-driven short-term strategies are the most sensitive to spread and commission.
What is the best forex indicator?
None is best in isolation. Moving averages, RSI, MACD, and Bollinger Bands are the most widely used because each measures something different and every platform includes them. The right choice depends on whether the market is trending or ranging and on your holding period.
How many indicators should I use?
Two or three that measure genuinely different properties. One trend tool, one momentum tool, and one volatility tool covers direction, timing, and risk without duplication.
Which indicators are leading and which are lagging?
Oscillators such as RSI and Stochastic react faster and are called leading, at the cost of more false signals. Moving averages and MACD confirm after the fact and are lagging, but more reliable. Every indicator is calculated from past prices, so none genuinely predicts.
Why does RSI stay overbought for so long?
Because RSI assumes mean reversion and a strong trend violates that assumption. Above 70 in a trending market indicates strength, not an imminent reversal. Check ADX or market structure before treating any overbought reading as a signal.
Should I change the default indicator settings?
Usually not. Defaults are widely watched, which makes them partly self-fulfilling, and optimising periods against past data tends to fit noise. Change the period only to match a different holding period, not to improve a backtest.
Do indicators work on all timeframes?
The calculations do, but reliability does not. Signals on M1 and M5 contain far more noise than the same signals on H4 or daily. Shorter timeframes also amplify trading costs relative to profit targets.
Can indicators be automated?
Yes. MT4 and MT5 Expert Advisors execute indicator-based rules automatically, which is covered in the automated forex trading guide. Automation makes the redundancy problem more expensive, since a rule built on four correlated oscillators will trade on false conviction without pausing.